D3 Deconstructor
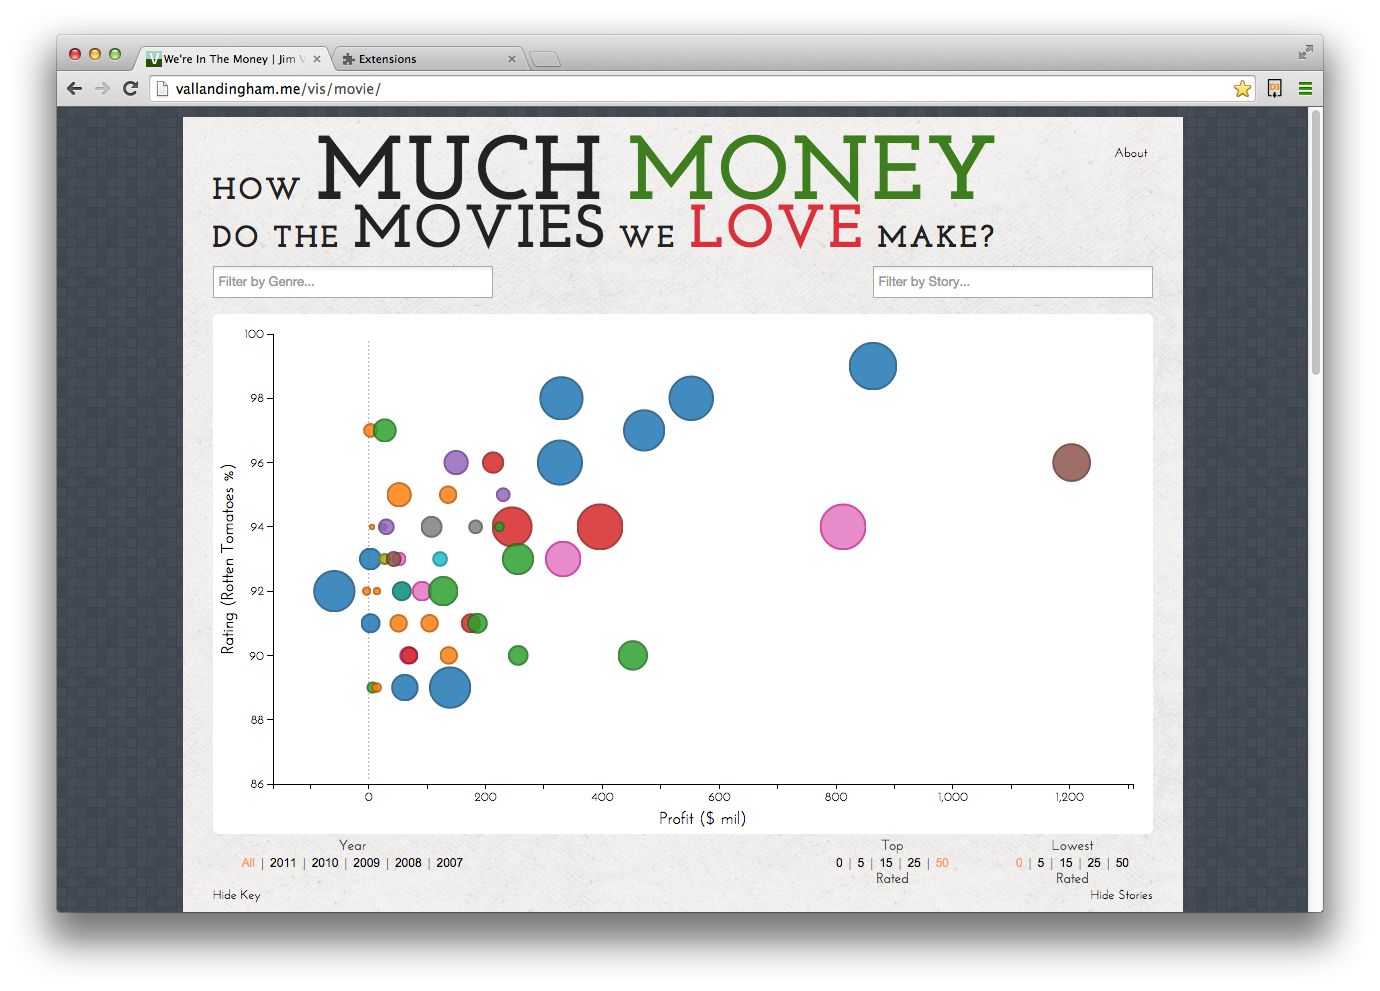
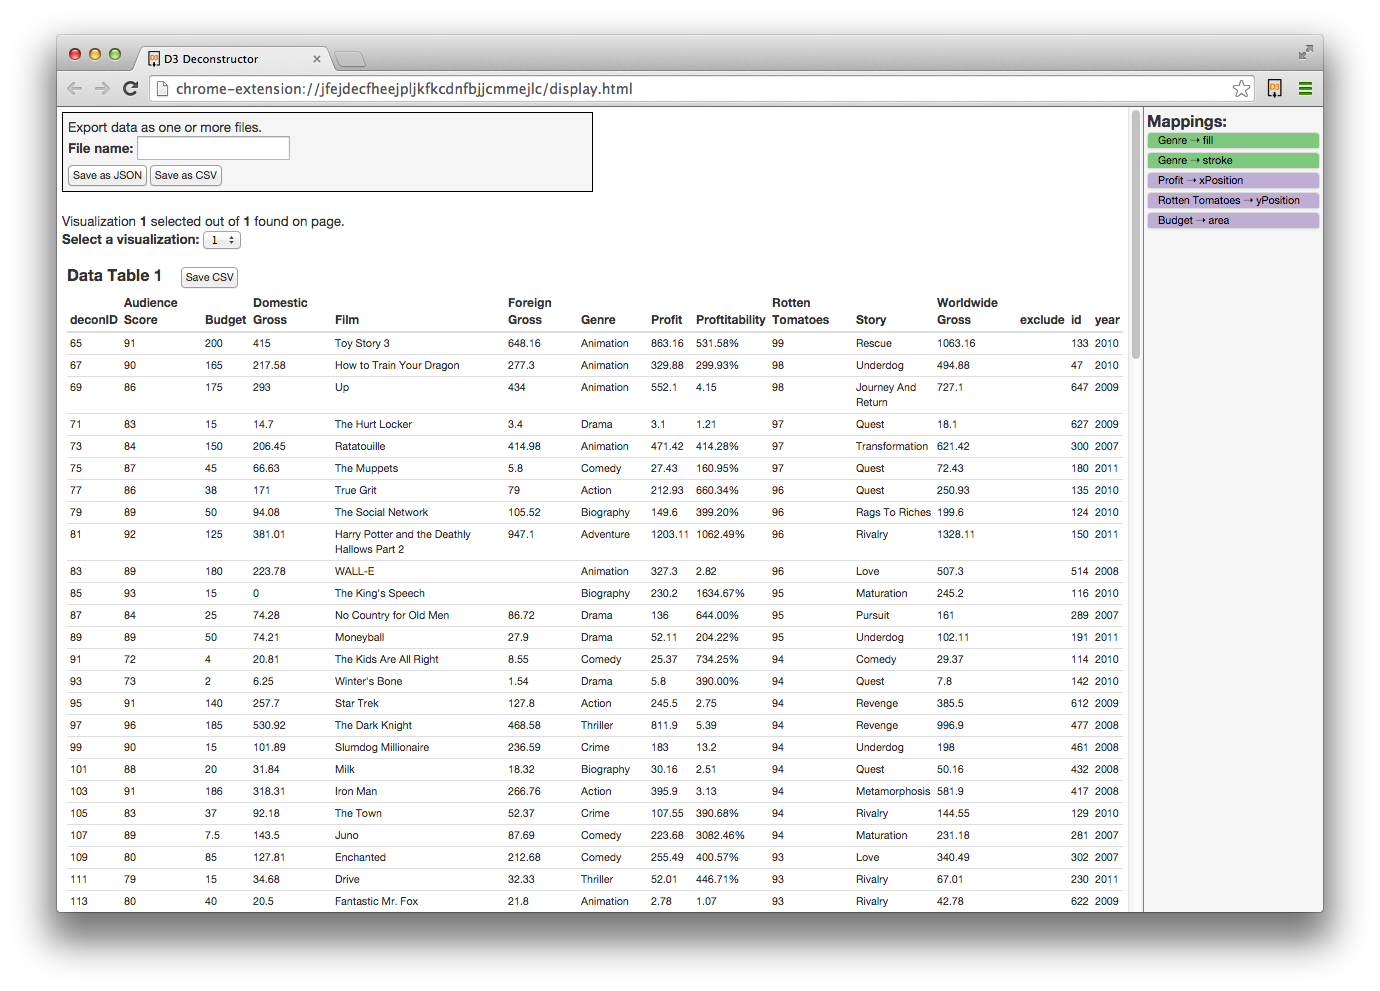
The D3 Deconstructor is a Google Chrome extension for extracting data from D3.js visualizations. D3 binds data to DOM elements when building a visualization. Our D3 Deconstructor extracts this data and the visual mark attributes (such as position, width, height, and color) for each element in a D3 visualization. In the example below, we apply the D3 Deconstructor on the visualization (left) by right clicking on it and selecting the extension from the context menu. The D3 Deconstructor then extracts the data table (right).

Original Visualization (by Jim Vallandingham)

Deconstructed Data Table
The D3 Deconstructor was developed in the VisLab at UC Berkeley. We also used the results of deconstruction to enable restyling of D3 visualizations. You can find the paper here: http://vis.berkeley.edu/papers/d3decon.
Usage
To extract data from a D3 visualization the user right clicks on the visualization and selects "Deconstruct Visualization" in the context menu. Deconstructor then creates a window showing the data tables for each group of elements. Then, you can save visualization data as JSON or CSV.
In addition to data and mark attributes, Deconstructor extracts the mappings between the data and marks in the visualizations. These mappings are saved when saving as JSON only. JSON output is an array of "schema" objects which have several properties:
- data - The data table for the visualization, represented as an object whose keys are the data column names and the value for each key is the array of data values in the column.
- attrs - The mark attribute table, represented using an object similar to data.
-
mappings - A list of mappings found for the group of marks. Each mapping is an object with several properties:
- type - The type of mapping; we extract mappings which are linear and one-to-one correspondences between data and attributes.
- data - Either a single data field name or an array of data field names for the mapping.
- attr - The mapped attribute.
- params - A set of parameters that describe the mapping.
- ids - A list containing a unique ID for each node, representing its order in a traversal of its SVG tree.
Install
The easiest way to install the D3 Deconstructor is via the Chrome Web Store. Check out our step-to-step tutorial to learn how to use the extension.
You can also download the source code for the D3 Deconstructor from our GitHub.
Any bugs, questions, or comments about the Deconstructor can be reported on the GitHub Issues Page.